

What Your Telematics Dashboard Is Really Telling You
What Your Telematics Dashboard Is Really Telling You
You logged into your telematics platform for the first time. Congratulations — now you’re staring at a wall of numbers, color-coded alerts, and charts that somehow all seem urgent. Don’t panic. Most new fleet managers feel this way. The good news is that you only need to focus on a handful of key metrics to make smart decisions.
Start With the Metrics That Cost You Money
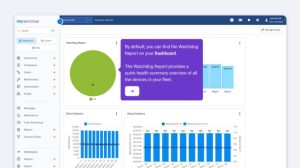
Your dashboard is a command center. It combines crucial data like vehicle locations, fuel efficiency, maintenance schedules, driving behavior, and overall performance metrics into one accessible interface. That sounds like a lot — because it is. So start with the metrics tied directly to your budget. Lytx
Fuel is your biggest target. Fleets that actively use telematics have reduced fuel costs by up to 14%. That number doesn’t happen by accident. It happens because managers pay attention to the right data points. The most critical KPIs for a commercial fleet include fuel economy, idle time percentage, and driver safety scores. GeotabAlliance
Idle Time Is the Silent Budget Killer
Idle time is one of the easiest wins on your dashboard. It is also one of the most ignored. An average heavy-duty truck consumes about one gallon of fuel per hour while idling. Now multiply that across your fleet. One hour of idling per week adds up to $65 per truck per year — and most fleets are not running just one truck. AllianceGeotab
Your telematics platform tracks idle time automatically. Therefore, there is no excuse for letting it run unchecked. In 2026, industry leaders target an idle time of less than 5%. Use that as your benchmark. If your trucks are sitting above that number, dig into the data and find out where it is happening. Alliance
Driver Behavior Scores Deserve Your Attention
Next, look at your driver behavior data. Key behaviors such as speeding, braking, acceleration, and idle time help fleet managers identify high-performing drivers, address risky driving habits, and implement targeted training programs. These scores are not about playing watchdog. They are about reducing risk and cutting costs. Lytx
Driver behaviors like speeding, idling, and harsh braking can impact fuel consumption by up to 30%. That means your driver scores are also your fuel scores. When you improve one, you improve the other. Furthermore, better driving habits directly lower your insurance exposure and vehicle wear. Geotab
Engine Fault Codes Are Maintenance Alerts in Disguise
Your dashboard also surfaces engine fault codes from each vehicle’s onboard computer. Many new managers skip past these. That is a mistake. You should track engine fault codes and harsh braking events to identify mechanical issues before they lead to roadside failures. Alliance
Think of fault codes as early warnings. A vehicle throwing a recurring code is telling you something before it breaks down on the side of a highway. Catching it early is always cheaper than a roadside repair and a tow.
Don’t Try to Monitor Everything at Once
Here is where new managers get overwhelmed. They try to act on every alert and metric simultaneously. Instead, build a simple daily habit. Fleet managers use dashboards as part of their daily oversight duties to monitor vehicle locations, track idle time percentages, review maintenance alerts, and respond to exceptions. Geotab
Start there. Review your top five exceptions each morning. Over time, you will learn which alerts are noise and which ones need action. Additionally, most platforms let you customize your dashboard so the most important data shows up first. Use that feature early and use it often.
Your Dashboard Is Only as Good as Your Follow-Through
Telematics data is powerful. But data sitting on a screen changes nothing. Fleets using GPS tracking reported an average 12% decrease in fuel costs in 2026 — but that savings came from managers who acted on what they saw. Your platform will surface the problems. Your job is to solve them. Verizon Connect
Start small. Pick two or three metrics and work them consistently. As a result, you will build confidence with the data and start seeing real improvements in your operation. That is exactly what the dashboard was built to do.
Also read: Navigation Guide: Your First Year in Fleet Management

