

Tires and Brakes Are Still Grounding Fleets in 2026
Even Top Fleets Have a Maintenance Problem
The gap between a well-run fleet and a national average fleet is wide. But even the best operations in the country are still losing ground on two of the most preventable violation categories in trucking — tires and brakes.
That is the central tension in the latest data from Fleet Advantage, released June 3, 2026. The Fort Lauderdale-based fleet analytics and financing company published the newest edition of its Truck Reliability and Usage Safety Tracker, known as the TRUST Safety Index, with a specific focus on top-performing logistics fleets. The results show those fleets running well ahead of national safety benchmarks. They also show those same fleets still struggling with the two maintenance categories that have topped out-of-service violation lists for years running.
Where the Top Fleets Stand
The benchmarking numbers in the latest TRUST Safety Index are genuinely strong. Top logistics organizations posted an average Inspection Selection System score of 34.17 — well below the FMCSA intervention threshold of 65 and significantly better than the broader private fleet benchmark average of 46.33. truckinginfo
The out-of-service rate gap is even more striking. Total out-of-service inspection rates averaged 9.28% among leading logistics fleets, less than half the national average of 20.18%. Vehicle out-of-service rates averaged 13.23%, compared with a national average of 22.26%, while driver out-of-service rates came in at just 1.11% — far below the national average of 6.67%. truckinginfo
On the compliance side, the numbers hold up just as well. Average Unsafe Driving BASIC scores measured 18.08, compared with the FMCSA national intervention threshold of 65, while Hours-of-Service BASIC scores averaged 41.91. MonitorDaily
For context, Fleet Advantage noted that the national out-of-service rate increased from 19.61% in the previous benchmark period, suggesting broader compliance challenges across the industry. The top logistics fleets are not just holding steady — they are separating further from the pack. truckinginfo
The Tire Gap Nobody Has Closed
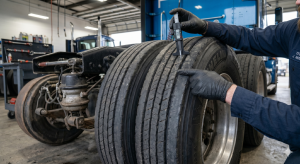
Despite those strong headline numbers, the tire data in the TRUST Safety Index demands a closer look. Tire-related violations accounted for 50% of all vehicle maintenance violations among the fleets studied — and 92% of out-of-service events. Fleet Advantage said the findings reinforce the value of proactive tire management programs and preventive maintenance practices. truckinginfo
That figure — 92% of OOS events traced to tires — is not a new pattern. The same category has dominated vehicle maintenance violation data across multiple editions of the TRUST index and across CVSA roadside inspection data year after year. What makes it significant in 2026 is that it persists even among the fleets doing nearly everything else right.
The reasons are well understood. Tires are a dynamic maintenance challenge. Pressure changes with temperature, load, and mileage. Tread wears at different rates depending on route type, driver behavior, and axle alignment. A tire that passes a Monday morning pre-trip inspection can become a violation by Wednesday afternoon. Under the February 2026 CSA overhaul, tire out-of-service violations carry a severity weight of 2 and score in the Driver Observed compliance category — meaning defects that should have been caught during a pre-trip walkaround now directly impact a carrier’s safety score as a separate metric. HVI
The technology to close this gap exists. Bridgestone’s Fleet Care tire monitoring service, for example, combines in-yard and real-time tire pressure monitoring sensors with digital inspections, and has demonstrated reductions in tire-related downtime by up to 40 percent. Automatic tire inflation systems and continuous pressure monitoring tools from suppliers including Pressure Systems International and Aperia Technologies give fleet managers real-time visibility into tire health between driver inspections — catching slow leaks and underinflation before they generate a violation or a blowout. Torquebyryder
Brakes: The Chronic Runner-Up
Brake violations remain the second major maintenance pressure point in the TRUST Safety Index data. The report found that “Brakes, All Other” violations represented 42% of vehicle maintenance violations among the top logistics fleets studied. The findings align with recent CVSA brake enforcement efforts that continue to identify brake defects as a leading cause of out-of-service violations. truckinginfo
This tracks with what CVSA inspection data shows year over year. Brake-system issues have accounted for more than 40% of all vehicle OOS outcomes in every recent Roadcheck cycle, regardless of the event’s named focus area. Out-of-adjustment slack adjusters, air leaks in brake chambers, and worn lining are the most commonly cited conditions — and all of them are catchable with a thorough pre-trip inspection.
The cost of getting it wrong is steep. Penalties for brake-related violations average $4,200 per incident, with repeat violations escalating to $19,277 for operating an out-of-service vehicle. A preventive slack adjuster replacement, by contrast, runs roughly $150 in parts. The math is straightforward. Implementing preventive slack adjuster replacement based on historical failure data is one of three actions that produce measurable results within 30 to 60 days, alongside mandating the full seven-step in-cab air brake test on every pre-trip and digitizing brake inspection records with photo evidence. OXMaintHVI
Dangerous Driving Rounds Out the Risk Picture
Beyond the maintenance categories, the TRUST Safety Index flagged a third persistent challenge. Dangerous driving behaviors accounted for 75% of unsafe-driving violations among the fleets studied. Fleet Advantage cited the importance of technologies and programs including advanced driver assistance systems, inward- and outward-facing cameras, driver scorecards, and ongoing driver coaching initiatives as key tools for addressing this category. Heavy Duty Trucking
That combination — ADAS hardware to catch events in real time, video to document and coach after the fact, and scorecards to create accountability over time — reflects how leading fleets are approaching driver behavior in 2026. The technology investment pays back through lower insurance exposure and a cleaner CSA profile, both of which matter more now than they did even a year ago. Fleet Advantage pointed to American Transportation Research Institute data showing trucking insurance premiums reached a record 10.2 cents per mile in 2024, following a 12.5% increase the prior year, and cited a 235% rise in nuclear verdicts since 2012 as additional pressure on fleet safety programs. truckinginfo
What the Data Tells Fleet Managers
The TRUST Safety Index is not simply a report card. Fleet Advantage designed it as a tool that allows organizations to shift from a reactive to a preventive approach, driving continuous safety improvements by combining advanced data analysis with proactive asset management. The index is available as a free download directly from Fleet Advantage and is worth putting in front of any maintenance team still treating tire and brake checks as a check-the-box exercise. Fieldtechnologiesonline
The broader message from the June 2026 data is hard to argue with. Top fleets can outperform national averages by a wide margin and still leave meaningful safety and compliance gains on the table. Tires and brakes are not exotic problems. They are routine ones — and routine problems respond to routine programs executed consistently, every day, before the first wheel turns.
Also read: Defend Your Fleet Against Dangerous Turning Accidents

